How it works
The map’s data lives in one file: map.ts or map.json. It describes the subject and the route a
newcomer takes through it. The renderer turns that data into the map site.
The file can grow long because it holds the whole territory, not just a lesson plan. Most people will get a coding agent to draft and maintain it; the skills teach the agent the model and the checks.
The territory: regions and items
Section titled “The territory: regions and items”domains are the map’s regions. Each region contains categories and items. You choose the item
kinds that fit your subject: the Physics example uses concepts, laws and methods; a software map
might use tools and practices. category is built in and groups items inside a region.
Each item also has a status that says how it relates to the route:
path— the learner uses it during onboarding. It belongs to a stage.context— it is useful to know the item exists, but it is not on the route.alternative— it is a real option the team considered and did not choose. Link it to the path item it could replace, and explain why it was not picked.
edges connect items that relate across categories or regions. Items can also carry explanations,
documentation links and source references.
Here is a short excerpt from a map of mechanics:
nodes: [ { id: 'velocity', label: 'Velocity', domain: 'kinematics', kind: 'concept', parent: 'motion', status: 'path', stage: 'describe', summary: 'How fast position changes, and in which direction.', },]The same file can mark another item status: 'context' or status: 'alternative'. Those distinctions
show the learner what they will use now, what is nearby, and what the team chose instead.
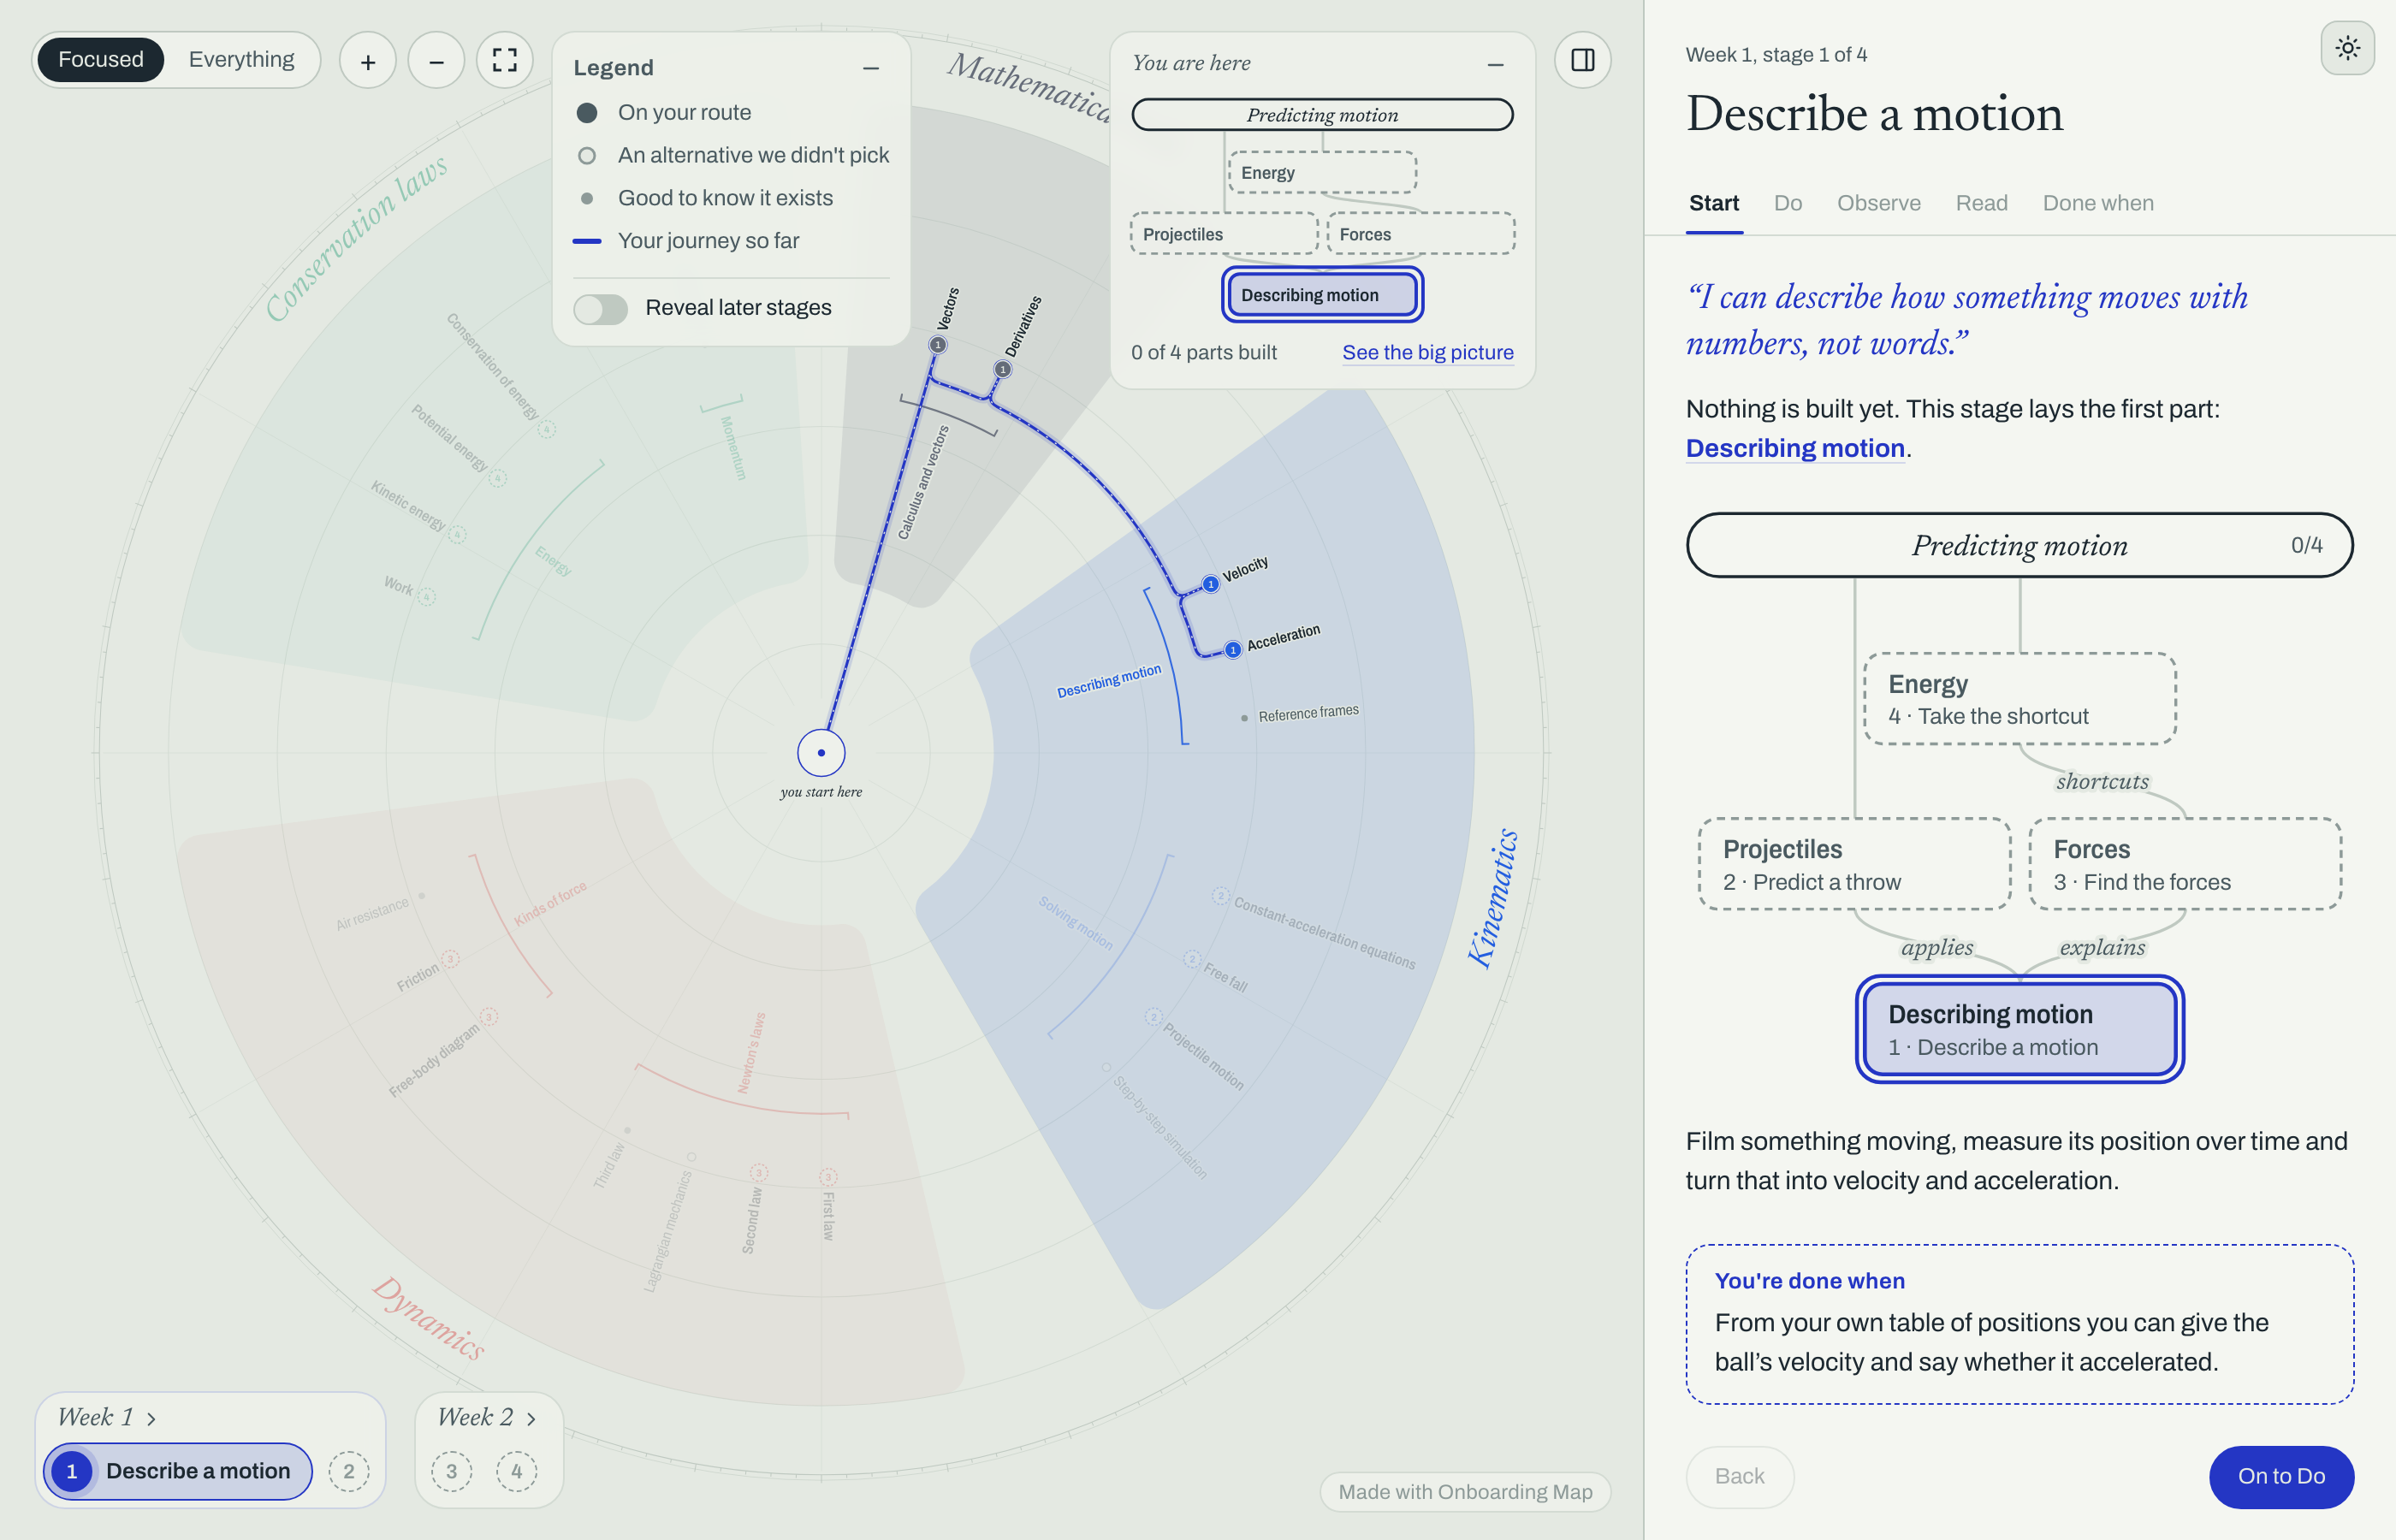
Physics example: the whole territory, with the first stage highlighted.
The map shows the whole territory at once. The route makes the next few steps visible without turning every item into a lesson.
The journey: stages and steps
Section titled “The journey: stages and steps”The stages field describes the route in order. A stage names one outcome, points to a few route
items, and gives the learner a checkpoint they can demonstrate.
Every stage follows the same sequence:
- Do something with the subject.
- Observe what happened.
- Read the relevant material after there is something to connect it to.
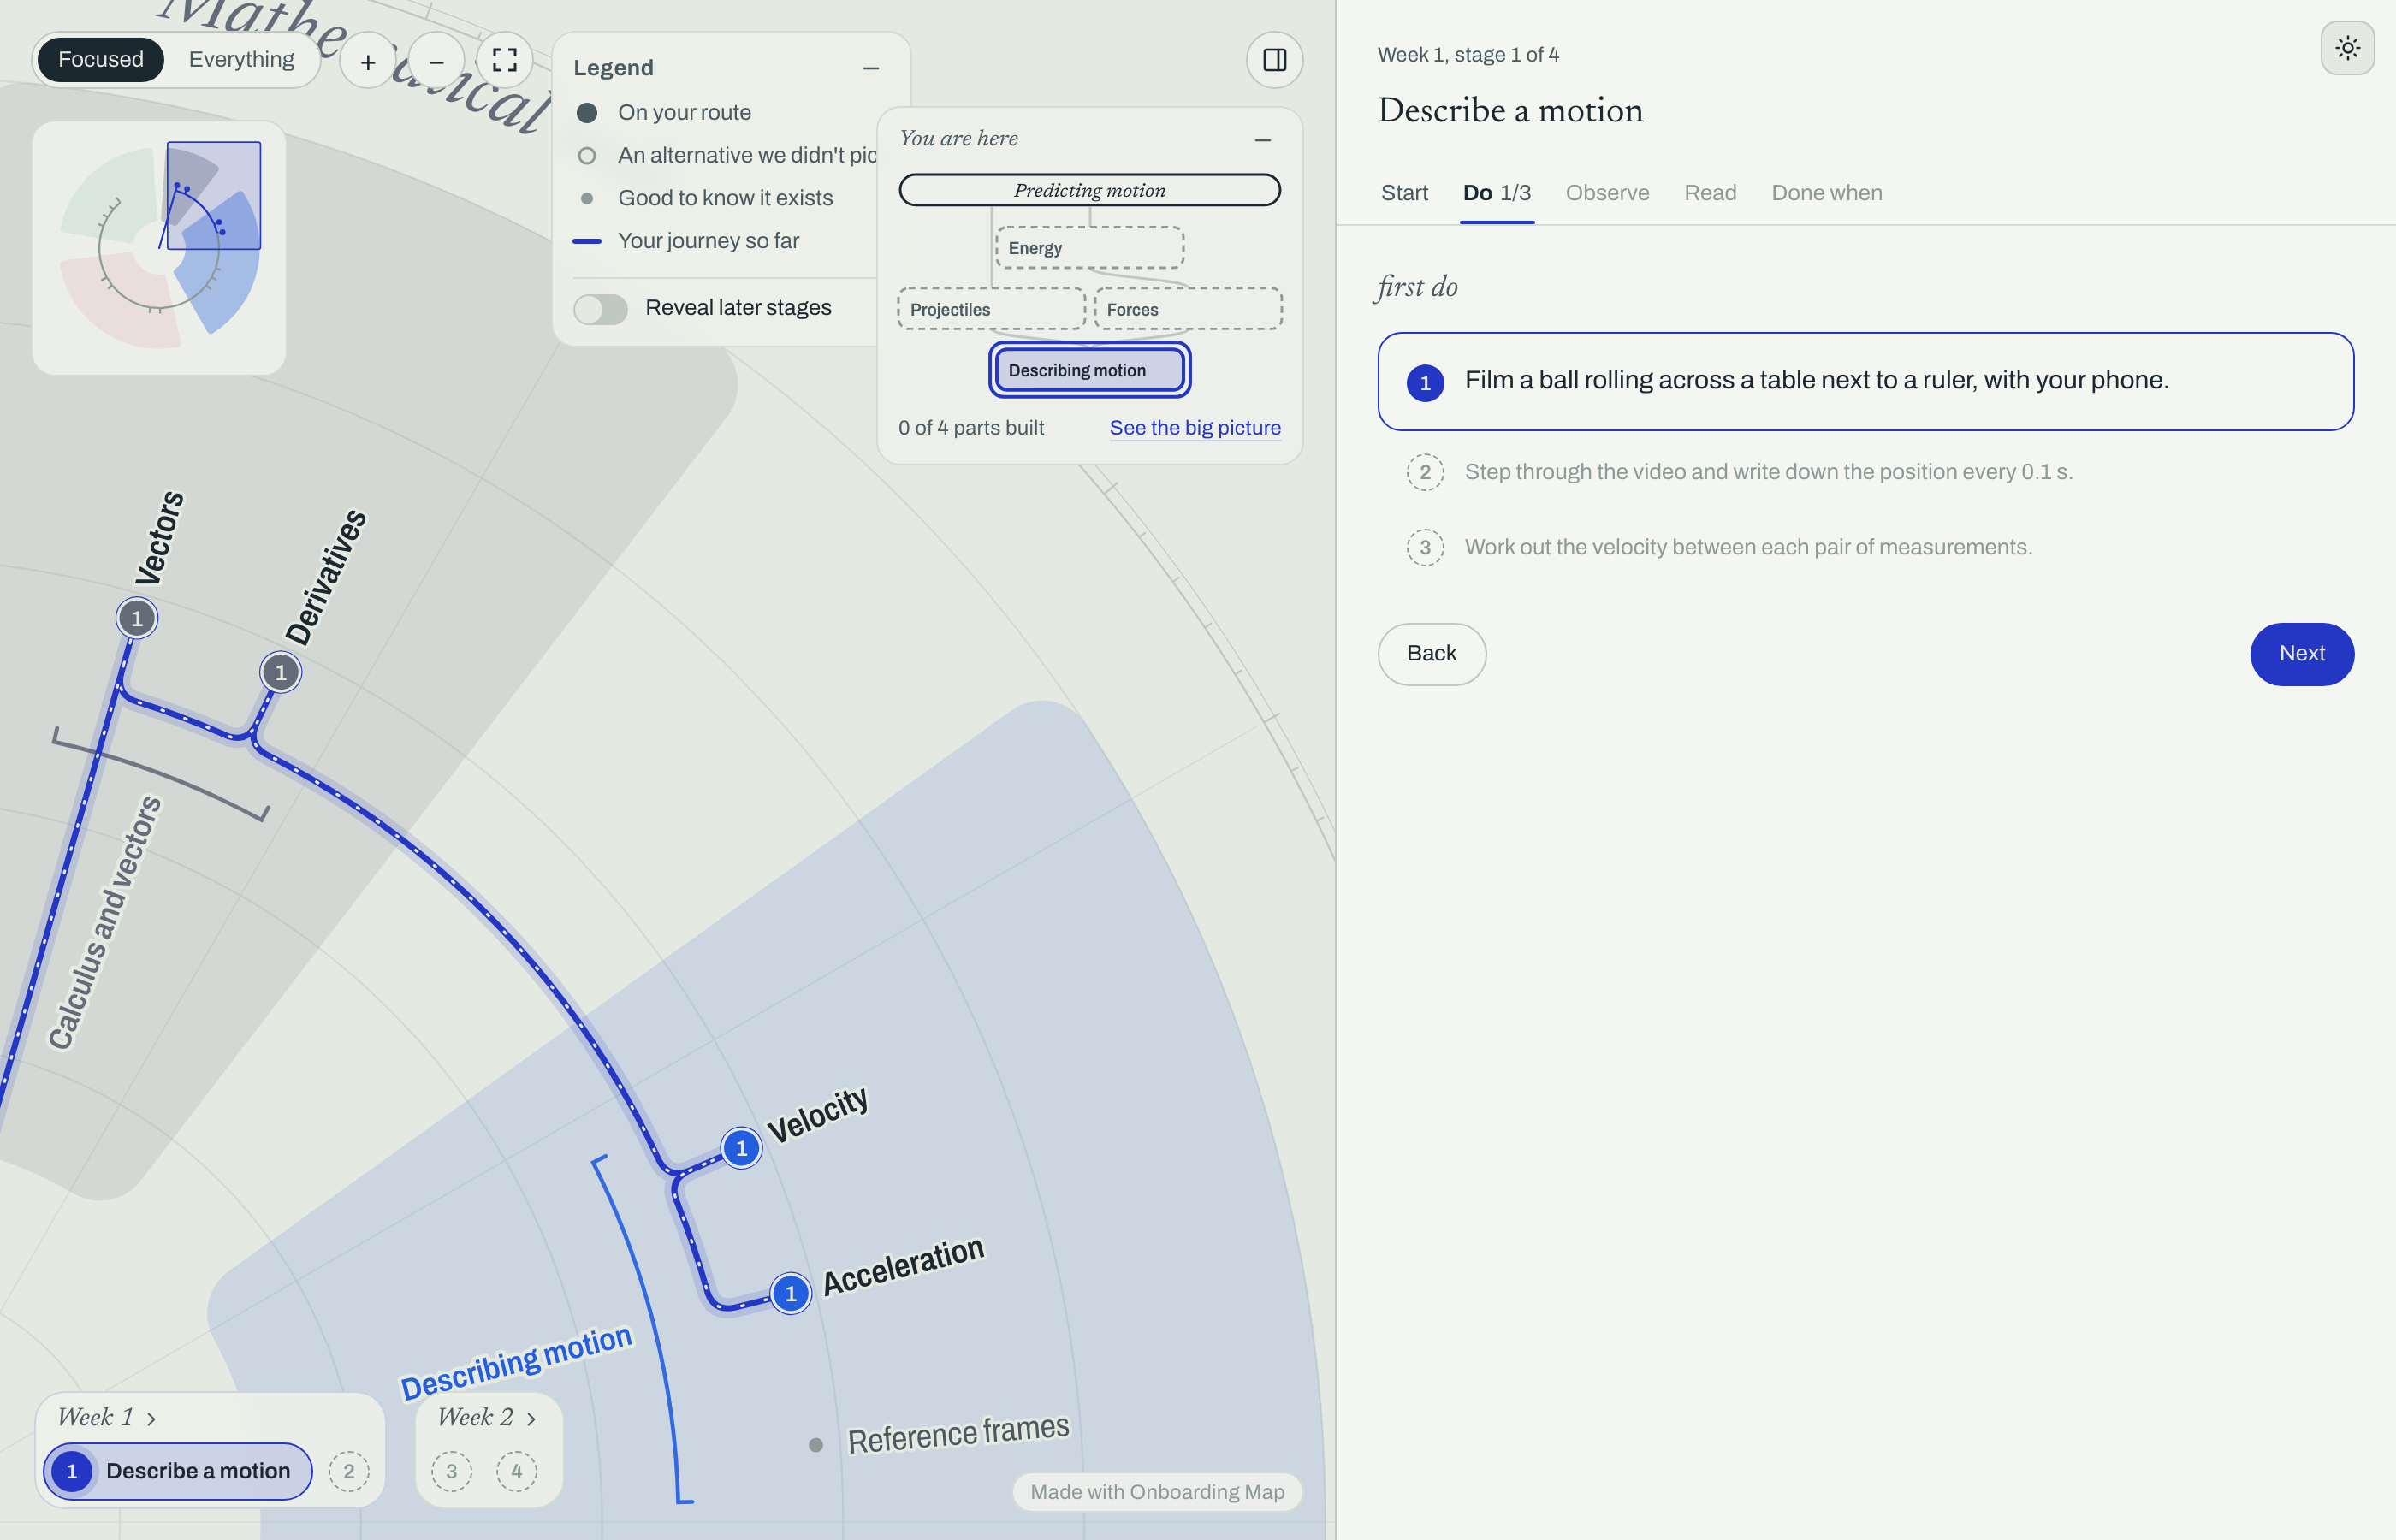
Physics example: the first Do step, with the map focused on the concepts it uses.
The goal is optional. When present, it describes the finished result in modules and shows how
stages build it. periods group stages into days, weeks or another span that fits the onboarding.
These names are the main pieces of the data model. The model reference lists their fields; examples show full maps alongside their data.
Next: get started.